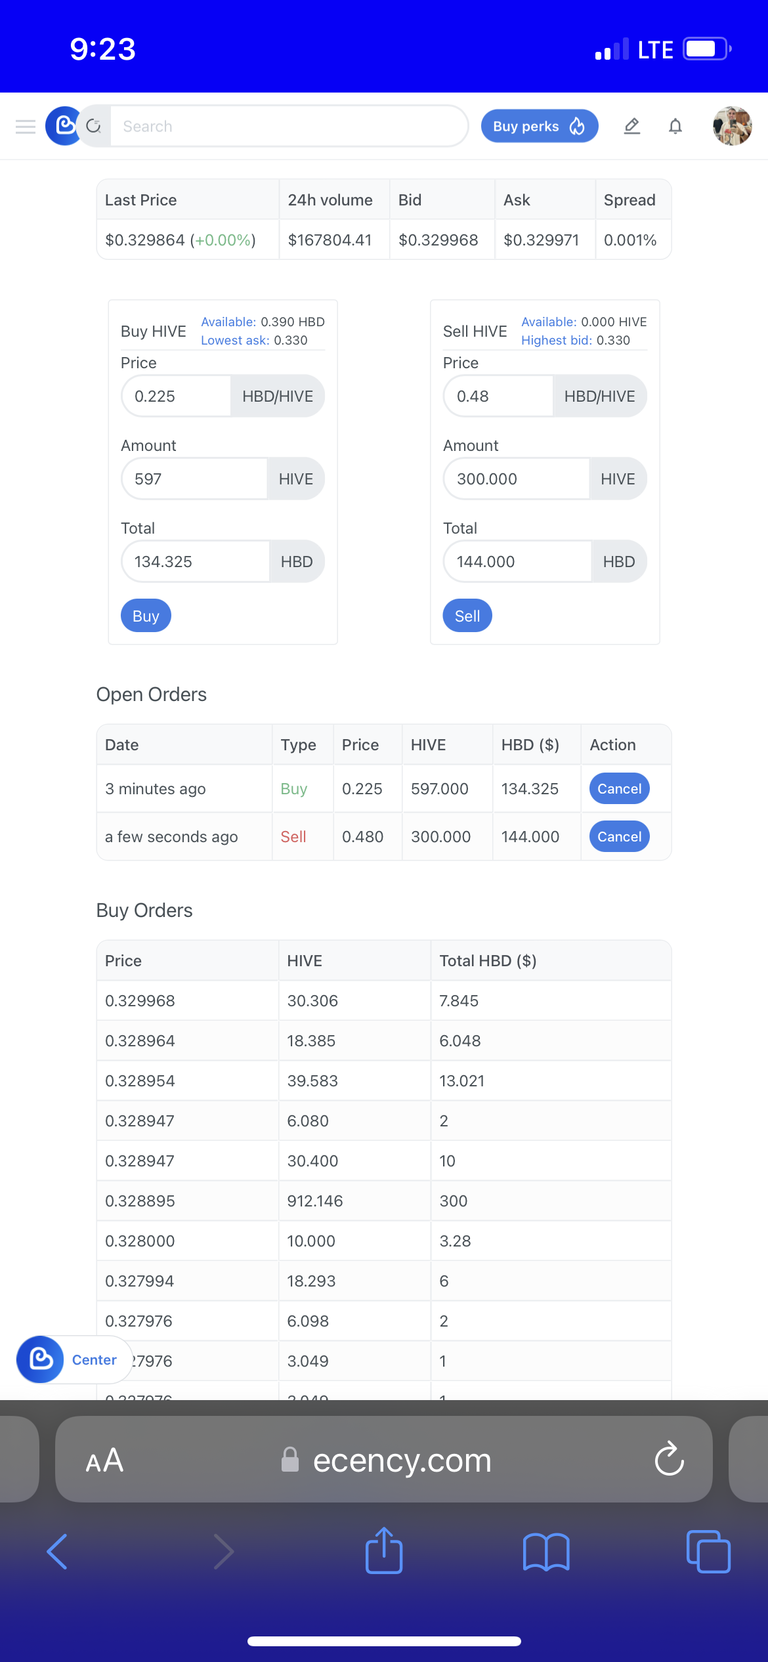
We live in a crazy world and if you're into trading, this is the norm. It's a roller coaster ride that never stops. Ups and downs, ups and downs, and this is how it goes.
If I want to be totally honest, this is what $HIVE has been doing lately. Today is Sunday, time for a new update, especially after what $HIVE did today.
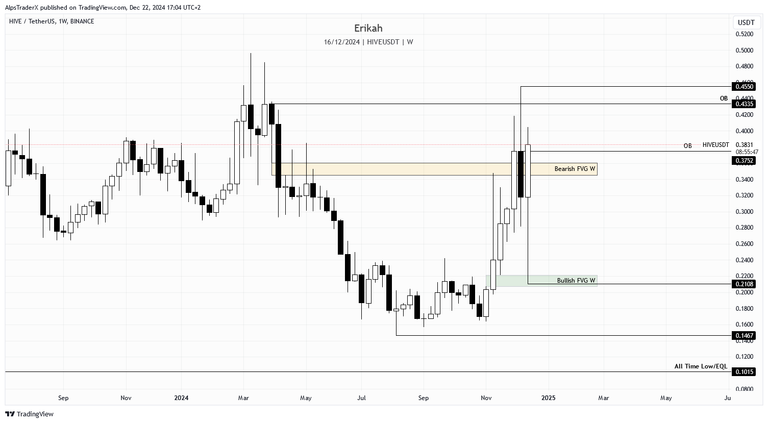
I'm going to start with the weekly chart, as the weekly candle is closing in about 9 hours and it's good to know what levels to watch.
As we all know, this week was the last working week before Christmas and of the year as well as I don't think institutions are going to work next week or after that. This means, as I mentioned in my previous post, the occasion to adjust their balances as they please and that's what we saw happen this week.
If you look at this week's candle, price dropped till $0.2108, rebalanced the bullish gap and came back to where it is now. If I say this was the most surprising candle of the year, that's an understatement. I am surprised to be honest as the last similar candle was in January 2023, which had a similar wick but to the upside, which is not so good, but it doesn't matter now.
At the moment of writing, price is above the bearish fair value gap (FVG), marked with yellow on my chart. Should the body of the current candle close above the gap and above the weekly OB ($0.3752), we can expect bullish continuation as the candle will be a bullish engulfing one. But again, we can only know when the candle closes and not sooner.
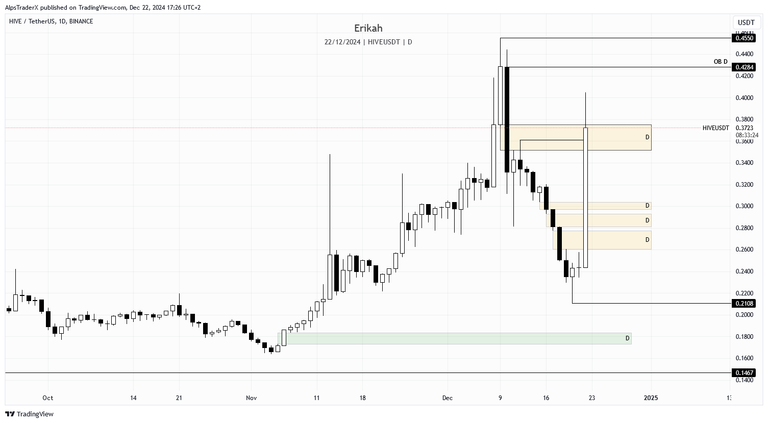
As happy as I am about the current price action of $HIVE, looking at the daily chart, I have to be realistic and focus on facts. At the time of writing, price rebalanced all four bearish gaps in one go, swept liquidity from the previous high at $0.3611 level and it is inside the last bearish FVG.
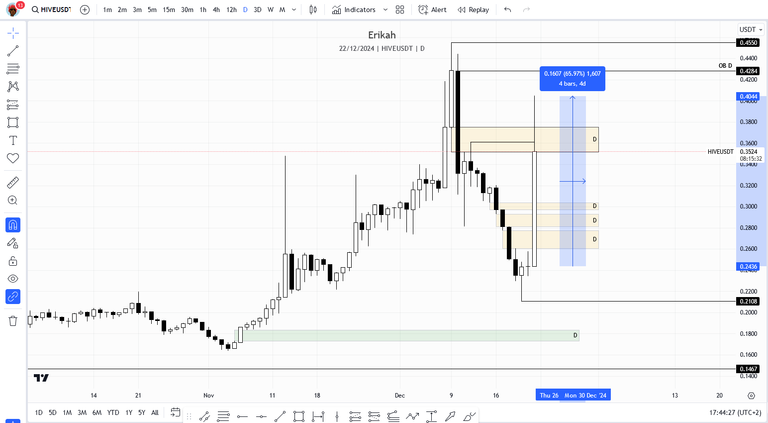
$HIVE had a 65% expansion today, which is not unusual in a bullmarket, but if you look at the other assets, I don't think you can find another asset with similar move. However, as nice as it is, when the buying pressure weakens, we're going to see a retrace. How deep? That remains to be seen. The yellow gaps on my chart should turn green, as price is above them, but I can't make the changes, till the candle closes. I'm expecting for the top gap to remain still bearish as most likely price is going to close below it and have another attempt to invert it later next week or so. The rest, I'm expecting to hold, but again, this is not about my expectation and we'll see what the market gives us.
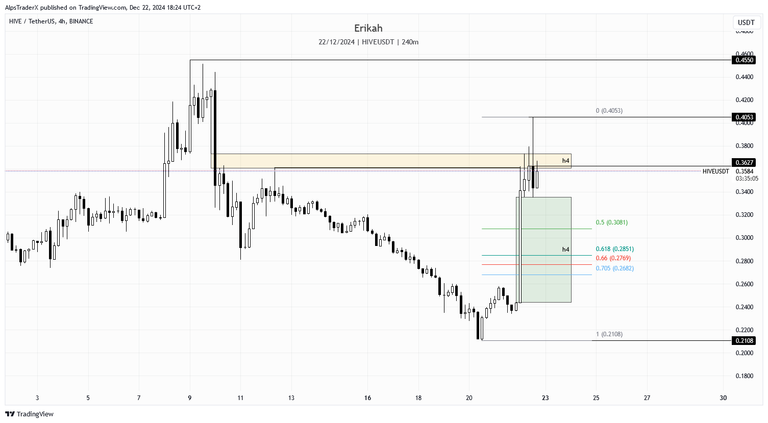
As a scalper, low time frames are my territory, so the h4 chart (which is still high time frame for me but it doesn't matter) looks way better for me, or more clear to be precise.
As you can see the bearish gap (yellow) is capping the market right now and rejected price. There's a huuuuuge bullish gap, marked with green, which is going to be retested sooner or later. So far price bounced off of the top of it, but that doesn't mean we're safe. I'm expecting a retrace to the $0.285 area which is in line with the golden pocket level, and a bounce from there, but only time can tell if it'll happen and when.
If we can hold this level and continue to the upside, closing above the gap and hold, then the next liquidity pool to be swept is at $0.4053 and $0.455 after that.
I'm not going to chart the h1 time frame as it looks almost similar regarding key levels, so let's have a look at what $BTC is doing instead.
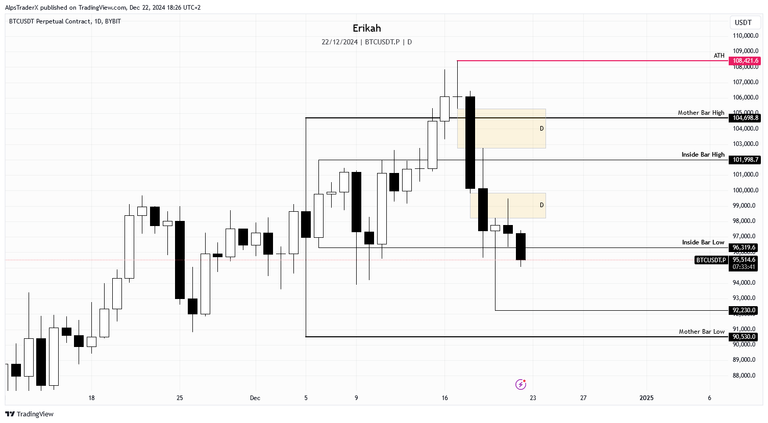
On the daily chart, $BTC looks pretty heavy. There are still 7 hours till the current daily candle close, but at the time of writing, price is below the inside bar low and should this candle close as it is, the next low to sweep is $92,230.
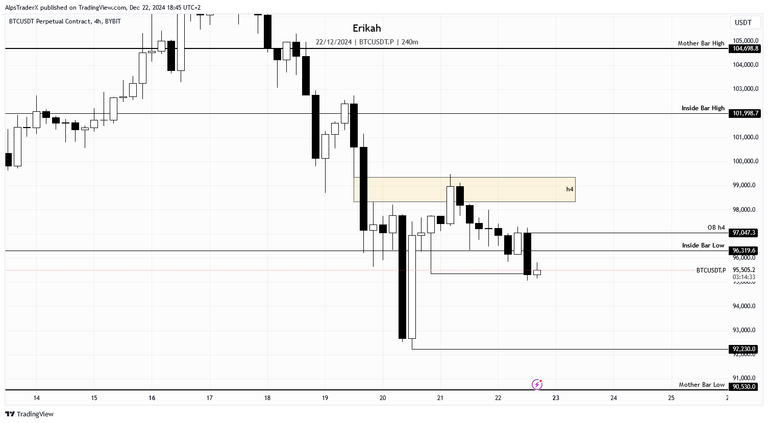
The h4 chart looks a bit better. Price swept liquidity from the $95,355 level, but I don't see any strength in the current candle. For bullish continuation price has to close above $97,047. Otherwise the next liquidity pool is at $92,230 next.
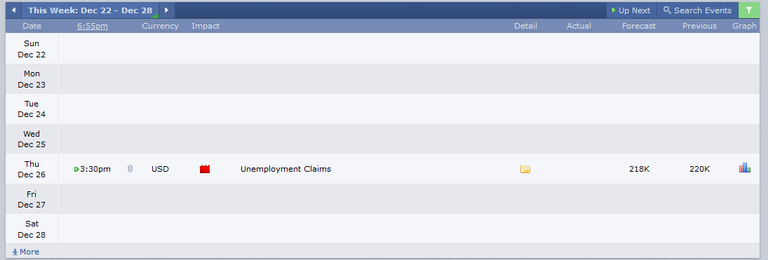
Next week, we have unemployment claims on the 26th, which could move the market both ways. Most likely we're going to have a choppy price action till the end of the year, so I don't know if I'm going to do another TA post, but we'll see. If price moves significantly, then I'll be back with an update.
Till then, stay safe and protect your capital.
As always, this is a game of probabilities, not certainties. Also please note, this is not financial advice, it's my view and understanding of the market.
All charts posted here are screenshots from Tradinview.

If you're a newbie, you may want to check out these guides:
- Communities Explained - Newbie Guide
- Cross Posting And Reposting Explained, Using PeakD
- Hive Is Not For Me
- How To Pump Your Reputation Fast - Newbie Guide
- Tips And Tricks & Useful Hive Tools For Newbies
- More Useful Tools On Hive - Newbie Guide
- Community List And Why It Is Important To Post In The Right Community
- Witnesses And Proposals Explained - Newbie Guide
- To Stake, Or Not To Stake - Newbie Guide
- Tags And Tagging - Newbie Guide
- Newbie Expectations And Reality
- About Dust Vote And Hive Reward Pool, by libertycrypto27

